The most advanced three.js inspector, devtools, and editor available. Needle Inspector helps you play with, investigate, debug, and understand every web app that uses three.js. This free Chrome extension works with Needle Engine, three.js, react-three-fiber, A-Frame, Threlte, model-viewer, and even Spline. Created by Needle Tools, it provides powerful debugging, WebGL inspection, real-time scene editing, and AI-powered assistance—all directly in your browser.
How to debug three.js with this inspector
This three.js inspector and scene viewer automatically detects three.js and WebGL projects on any webpage, providing professional-grade debugging and editing capabilities. When you visit a site using three.js or react-three-fiber (r3f), the Needle Inspector hooks into the scene and gives you immediate access to:
Three.js Scene Viewer & Hierarchy
View and debug three.js scenes with an organized tree structure, just like you would in Unity or Blender. This three.js scene viewer shows meshes, lights, cameras, and all objects at a glance. Perfect for debugging threejs and r3f projects. Filter by search terms or hide inactive objects for a cleaner view.
Real-time Scene Editing & Free Camera Mode
Edit three.js scenes directly in your browser with this powerful three.js editor. Modify object properties, adjust positions, rotations, scale, materials, textures, and more—changes apply instantly to the live scene. Enable free-camera mode and fly anywhere to explore your scene from any angle. Export your modifications as JSON or plain text to preserve your work. It's like having a three.js editor built right into Chrome DevTools.
Performance Monitoring
Track FPS in real-time and view download size estimations to understand the performance characteristics of your 3D scenes.
Node Graphs, Shader Code & Render Insight
See how your frame and shaders are actually built — for both the WebGL and WebGPU renderers. Explore materials as node graphs (including three.js TSL / node materials) and drill from the scene into materials and subgraphs. Capture a frame in the render graph to see every render call, pass and target — and open the code panel for the TSL, compiled shader and three.js source behind any selection.
Resources & Memory Debugging
Find out what's actually loaded, what it costs, and what never unloads. The resources panel lists every texture, geometry and material with memory estimates and tracks loads and unloads — memory leaks show up as rows that never disappear. The perfect companion for debugging three.js memory usage and GPU memory.
Advanced Inspector Tools & GUI Integration
Inspect material properties with texture previews, use search filters to quickly find specific properties, and benefit from a streamlined UI that hides advanced options until needed. Understand every mesh, texture, and node in your project with sophisticated tooltips and built-in documentation. Works seamlessly with lil-gui and dat.gui out of the box, automatically detecting and integrating existing GUI controls. This three.js gui tool provides a complete debugging interface without needing to set up custom controls.
Integrated AI Support
Connect your local AI assistant (Claude, Cursor, etc.) via MCP server support. The AI can inspect your scene
hierarchy, analyze properties, measure performance metrics, and provide intelligent assistance while you
work. Your agent can even pull the edits you made by hand in the inspector and apply them to your source code. Just run npx needle-cloud start to get started. Learn more about MCP integration or read the full documentation.
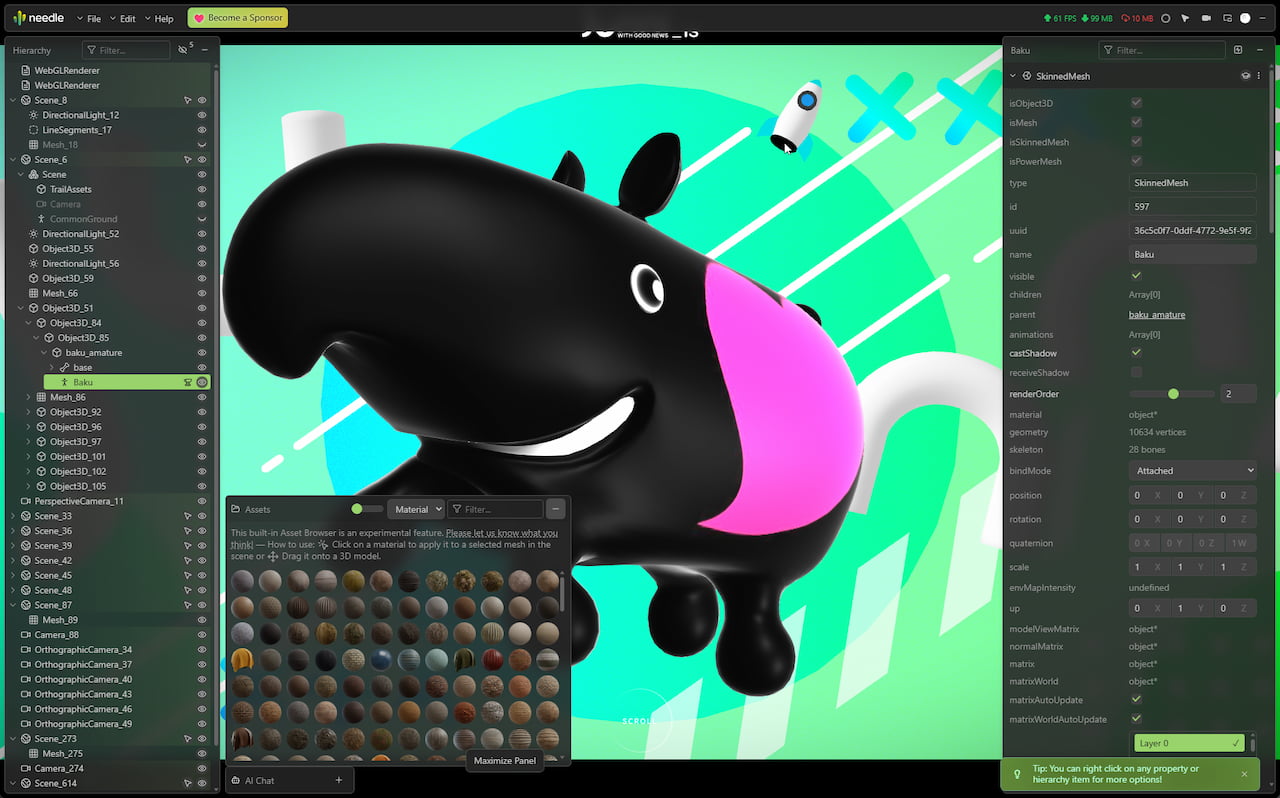
Built-in Asset Browser & More
Browse a curated asset library with HDRi environments and materials — drag a material onto any mesh, or set an HDRi as the scene environment with one click. Open isolated 3D views for specific scene parts, or render the inspector UI in a separate window for maximum workspace flexibility.
The best way to debug three.js and react-three-fiber
If you're developing, debugging, or learning three.js, this three.js inspector and debugging tool eliminates the frustration of blind
development. Instead of writing console.log statements or repeatedly refreshing the page to
test changes, you get immediate visual feedback, interactive scene editing, and performance insights for your WebGL and 3D
scenes—just like Unity or Unreal Engine devtools, but for three.js. Essential react-three-fiber devtools for r3f developers.
Free to inspect — Pro to go deeper and edit your own projects
The rule is simple: looking is free — going deeper is Pro. Inspecting, debugging and learning from any three.js website is free forever. Needle Inspector Pro — a one-time purchase, no subscription — unlocks live-editing your own (local) projects, the full resource list, node-graph drill-down with full TSL & compiled shader output, MCP & AI editing, and exporting your changes as GLB or changesets. It's included with every Needle Engine Pro license. See the full Free vs Pro comparison — the current price is shown right in the extension (Get Pro in the toolbar).
Perfect for
- Three.js developers who need to debug three.js rendering issues or optimize performance
- React-three-fiber (r3f) developers who need r3f devtools for debugging
- A-Frame, Threlte, and model-viewer developers debugging 3D web experiences
- Spline users who want to inspect and debug their exported projects
- WebGL developers who need a WebGL inspector for scene debugging
- Developers looking for a three.js GUI tool that automatically creates UI for lil-gui or want to replace Lerna
- Designers fine-tuning 3D positions and material properties
- Students learning three.js who want to understand scene hierarchies
- Anyone inspecting how three.js websites are built
The Needle Inspector transforms your browser into a powerful three.js inspector, GUI tool, and 3D development environment. Whether you need to debug three.js, inspect WebGL scenes, use a three.js GUI tool with automatic lil-gui UI creation, leverage react-three-fiber devtools, or edit scenes in real-time, this extension does it all. Install it today and experience the difference.
Building with three.js? There's more.
The Inspector is one of several tools we make for 3D on the web:
What developers are saying

"A must have for any threejs developer! Makes debugging much easier. Finally, threejs start to look like modern 3D Engines like Unity, Godot, Unreal, etc... Ever wonder why you don't see your object? Just have a look to camera coordinates. Ever tried to write a test with a very specific point of view? Just move your camera and copy/paste camera transform to your test. Ever wonder in which axis you should rotate your .fbx so it is not upside down when importing in threejs? Just do it in the inspector..."

"absolute gold dust, what a release"

"It is just soooo good, thanks for creating such an amazing dev tool!!"

"A must have tool for pros, beginners, and everything in between !"

"Amazing!"

"This is awesome. I can even see the different meshes I've separately named in Blender here just by hovering. One addition is maybe it could tell us how/where to optimize the scene (as it shows memory usage to be RED in color, but doesn't specify WHY) and also maybe show the website's overall size along with it as well. Nonetheless, This is such a great start for the extension. Thank you very much."

"This extension in 5 minutes helped me solving a visual issue I was struggling to fix for two weeks. A must have for all ThreeJS devs"

"Awesome devtool for threejs, highly recommended. Yet there is an issue: I want to use threejs-devtool along with it, yet I notice with this tool enabled, the threejs-devtool reads nothing from the site. It will be appreciated that the tools are not exclusive."

"I use it to document my three.js projects and create thumbnails. The ability to hide or move elements on the fly for screen captures is incredibly useful, and being able to quickly swap out textures makes experimenting much faster. The latest update added camera smoothing to the free-look mode. As a designer rather than a developer, it makes everything less abstract."

"Simply the best Three.js extension I've ever tested. Bravo!"

"Game changer when working with three.js. Feels like magic the first time you use it."

"works like a charm. Thank you for your hard work Needle team!"

"Love it! Not only does this give access to the entire scene structure, it's very useful to see what's actually going on in a three.js or Needle scene. The fly camera is a great tool as well."

"This is a really good tool for inspecting any three.js scene. It's extremely useful for quickly debugging your own projects, but it's also great for analyzing and learning how other websites are structured without painfully digging through the default browser dev tools. It does everything the official three.js editor does—just better! If you're a WebGL developer, it's a must-have in your toolbox."
Read more reviews on Chrome Web Store →
Frequently Asked Questions
How do I debug three.js scenes?
Install the Needle Inspector Chrome extension to debug three.js scenes. It automatically detects three.js projects and provides a visual scene hierarchy, real-time property editing, and performance monitoring. As one user said: "Finally, threejs starts to look like modern 3D Engines like Unity, Godot, Unreal, etc." It makes debugging much easier than console.log statements.
Does this work with react-three-fiber (r3f)?
Yes! Needle Inspector is the best react-three-fiber devtools available. It works perfectly with r3f projects, automatically detecting and providing debugging tools for react-three-fiber scenes. It's essential r3f devtools for debugging rendering issues and optimizing performance.
Does Needle Inspector work with lil-gui and other three.js GUI tools?
Yes! Needle Inspector automatically creates UI for lil-gui controls, detecting them and providing an integrated debugging interface. It can replace tools like Lerna for three.js scene inspection and editing. It provides a complete visual interface for debugging and editing three.js scenes directly in your browser DevTools. Users report it does everything the official three.js editor does—just better.
Is Needle Inspector free?
The extension is free to install, and inspecting, debugging and learning from any three.js website is free forever. Needle Inspector Pro — a one-time purchase, included with Needle Engine Pro — unlocks live-editing your own local projects, the full resource list, node-graph drill-down with full shader/TSL output, MCP & AI editing, and exporting your changes. As users describe it: "A must have tool for pros, beginners, and everything in between!"
What makes Needle Inspector better than the official three.js editor?
Needle Inspector works directly in your browser on any three.js website, providing real-time debugging and editing of live scenes. Unlike the official three.js editor, you don't need to export/import files - just visit any three.js site and start debugging immediately. Users report: "This extension in 5 minutes helped me solving a visual issue I was struggling to fix for two weeks."